Child Height Percentiles Without the Panic
Understand what a growth-chart percentile compares, why the chart and measurement method matter, and why a trend is more informative than one isolated point.
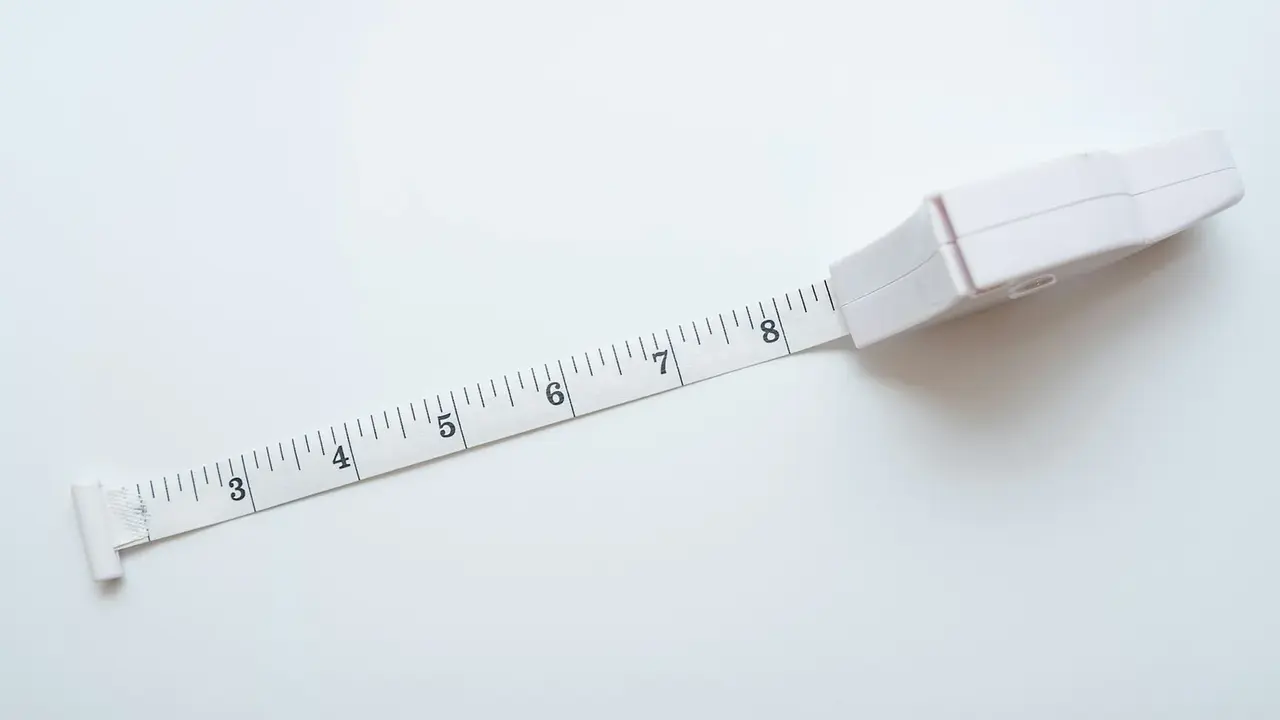
A height percentile compares a child’s measurement with a reference distribution for children of the same age and sex. The 70th percentile means the height is greater than or equal to that of roughly 70% of the reference group; it does not mean the child has completed 70% of their growth or is 70% as tall as an adult.
The utilkit Height Calculator can provide an educational estimate from the supported reference. It is not a diagnosis or a prediction of final adult height. Pediatric growth should be interpreted over time by a qualified health professional using the chart and measurement method appropriate to the child.
Know which chart is being used
The CDC growth-chart resources describe percentile curves for U.S. children and adolescents. The WHO Child Growth Standards provide international standards for early childhood. In U.S. practice, WHO standards are commonly used from birth to age two and CDC charts from age two onward, but clinical context matters.
Different charts, ages, sex references, and rounding methods can return different percentiles from the same measurement. Record the exact birth date, measurement date, units, and chart. Comparing a clinic result with an online result is meaningful only when those inputs and references match.
Measurement error matters
Infants are measured lying down for recumbent length; older children are measured standing for stature. Shoes, posture, head position, equipment, and time of day can change the result. A small measurement difference can move a percentile, particularly at some ages and parts of the curve.
Use proper equipment and technique, and do not overreact to one home measurement. Clinicians may repeat a surprising result before interpreting it. Growth velocity—the change over a meaningful interval—often matters more than one point.
A percentile is not a grade
The 50th percentile is not an ideal target, and a high or low percentile is not automatically healthy or unhealthy. Genetics, birth history, nutrition, health conditions, medications, and pubertal timing influence growth. Many healthy children track consistently on curves far from the median.
A clinician looks at the pattern, family context, weight and other measurements, development, symptoms, and the spacing between visits. Crossing percentile lines can have many explanations, including measurement variation, normal catch-up or catch-down growth, and a change worth evaluating.
Use the result as a conversation aid
- Confirm age, sex reference, units, and chart source.
- Prefer trained measurements over casual estimates.
- Compare a series of points, not one percentile.
- Do not use height percentile alone to judge health or nutrition.
- Bring persistent concerns or unexpected changes to the child’s clinician.
Improve the measurement before interpreting the chart
For a standing height measurement, remove shoes and bulky hair accessories, use a hard level floor and vertical surface, and position the child according to the measuring equipment’s instructions. Read the value at eye level and record the date, age, unit, and method. Small technique differences can move a point enough to look meaningful on a chart, especially when measurements are close together.
If a new value seems surprising, check for a unit-entry error and compare it with the clinical record rather than repeatedly measuring until one result feels right. Growth assessment may use length for younger children and standing height later, and the reference chart must match the child’s age and sex. A clinician may also consider family growth patterns, puberty timing, medical history, nutrition, and other measurements that a percentile calculator does not know.
Useful questions include: Is this measurement comparable with the earlier ones? Has the pattern changed across several visits? Could technique explain the difference? Is follow-up recommended, and on what timeline? Seek professional evaluation for concerns about growth, development, symptoms, or an unexpected pattern. The goal is not to defend a percentile but to understand whether the complete growth history needs attention.
Keep charts out of casual comparison between children. Percentiles do not predict adult height with certainty, measure effort, or define a desirable rank. If you save measurements at home, protect them as health information and avoid sharing them publicly without a reason. Bring the dated record to a clinical visit when it helps, but expect the clinician to rely on properly collected measurements and the broader history. The best use of the chart is a calm, specific conversation about a pattern—not repeated checking for reassurance.
If follow-up is recommended, write down the time interval, measurement method, and specific question the next visit will answer. Avoid major diet, supplement, or exercise changes for a child based only on an online percentile. Growth decisions can involve nutrition, development, family history, and medical conditions that require individualized assessment. A clear follow-up plan protects against both dismissing a meaningful pattern and overreacting to one imprecise point.
A percentile answers a narrow statistical question about a reference population. Its value comes from consistent measurement and longitudinal context. Used that way, it can help families understand what a clinician is tracking without turning normal human variation into a score.